Frameworks hide the rendering pipeline behind declarative syntax, making synchronous blocking code inside render methods feel fine locally but cause frame drops under load
A component that parses JSON, processes a dataset, or makes a synchronous API call inside render works fine with 100 items — it jank with 10,000 items because the browser has no idea you are doing expensive work
The framework does not care about timing. It cares about correctness. You can write code that is logically correct but temporally impossible, and the framework will let you ship it
Production reveals timing bugs that local development cannot because local has tiny datasets, no competing tasks, and no real user load — all the conditions that hide synchronous work inside async pipelines
I watched a team spend three days debugging an issue that did not exist in development.
The app rendered perfectly on their machines. A list of items loaded instantly. Filters worked. Sorting worked. Every interaction felt smooth. They deployed to production with confidence.
In production, the same list was jank. Users scrolling through data saw the UI freeze for hundreds of milliseconds. The browser frame rate dropped from 60fps to 10fps. The app became unusable.
The code had no errors. The database was fast. The API responses were quick. The problem was that the component was doing 200 milliseconds of synchronous work during every render, and the browser cannot drop frames while the JavaScript thread is busy. The developer had written logically correct code that was temporally impossible. The framework let them.
This is the core problem with modern frameworks. They are so good at hiding complexity that they let you write code that is invisible broken until production load exposes it.
What the Framework Hides
A React component is supposed to be a pure function. You pass in props, it returns JSX. That is the mental model. That is what the documentation teaches.
But underneath that simple abstraction is a machine. The browser has a rendering pipeline. Every 16.67 milliseconds (at 60fps), the browser needs to:
Run JavaScript
Calculate layout (reflow)
Paint pixels (repaint)
Composite layers
Display the frame
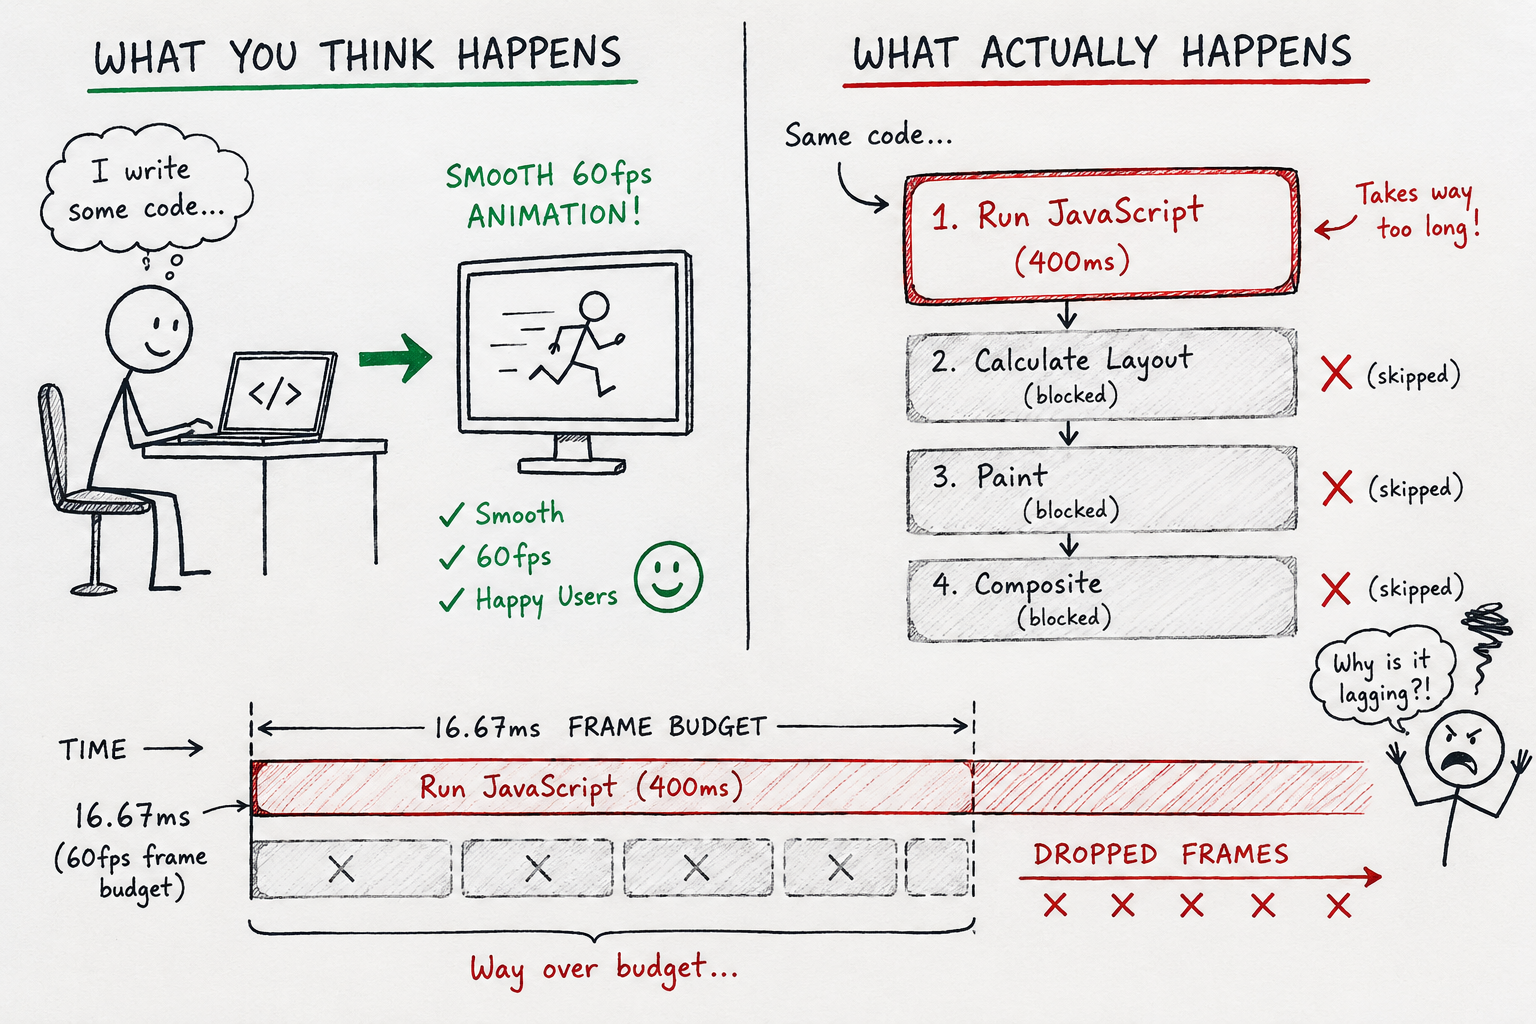
All of this needs to happen in 16.67 milliseconds. If your JavaScript takes 20 milliseconds, the frame is already late. The user sees it: dropped frame. Jank.
On your machine with 50 users, this renders instantly. The work takes 2 milliseconds. The browser frames at 60fps. It feels fast.
In production with 5000 users, this same code takes 400 milliseconds. For 400 milliseconds, the JavaScript thread is blocked. The browser cannot paint. The user scrolls and nothing happens for almost half a second. They think the app is frozen.
The React component does not care. It is not its job to care. React is a library for describing UI state. It does not know about frame budgets. It does not know that you just did 400 milliseconds of work on the main thread. It just rendered what you told it to render.
The framework hid the machine so completely that you did not even know you were breaking it.
A hand-drawn split diagram. Left side labeled "What You Think Happens": simple stick figure writing code at a desk with an arrow pointing to a happy screen showing smooth animation. Right side labeled "What Actually Happens": the same code, but now showing a browser rendering pipeline with boxes for JavaScript, Layout, Paint, Composite - and a bar showing JavaScript taking up 400ms, blocking all the other steps. The blocked steps have red X marks. Use sketch style, left side green/happy, right side red/frustrated.
Why Local Development Is a Lie
Your development machine is a lie. It is the best possible version of your application.
You have 50 test records. Production has 50,000. You have zero network latency (localhost). Production has real latency. You have the CPU of your personal machine running only your app. Production shares CPU with thousands of other services.
Most importantly: you have no competing tasks. When React renders, there is nothing else trying to use the JavaScript thread.
In production, there are thousands of competing tasks. Analytics. Ad networks. Browser extensions. Other JavaScript on the page. Service workers. The browser is trying to record interaction timing. Something is trying to request idle callback.
A component that does 50 milliseconds of synchronous work locally might do 200 milliseconds in production simply because the CPU is not available all the time.
Your code does not change. Your data scales. Your environment changes. Suddenly the frame rate collapses.
And you have no idea it is happening because your tools did not tell you. React did not warn you. The build process did not flag it. You thought you had tested it.
You tested it in the wrong environment.
The Categories of Hidden Timing Bugs
Let me list the patterns that developers write that work locally and break in production:
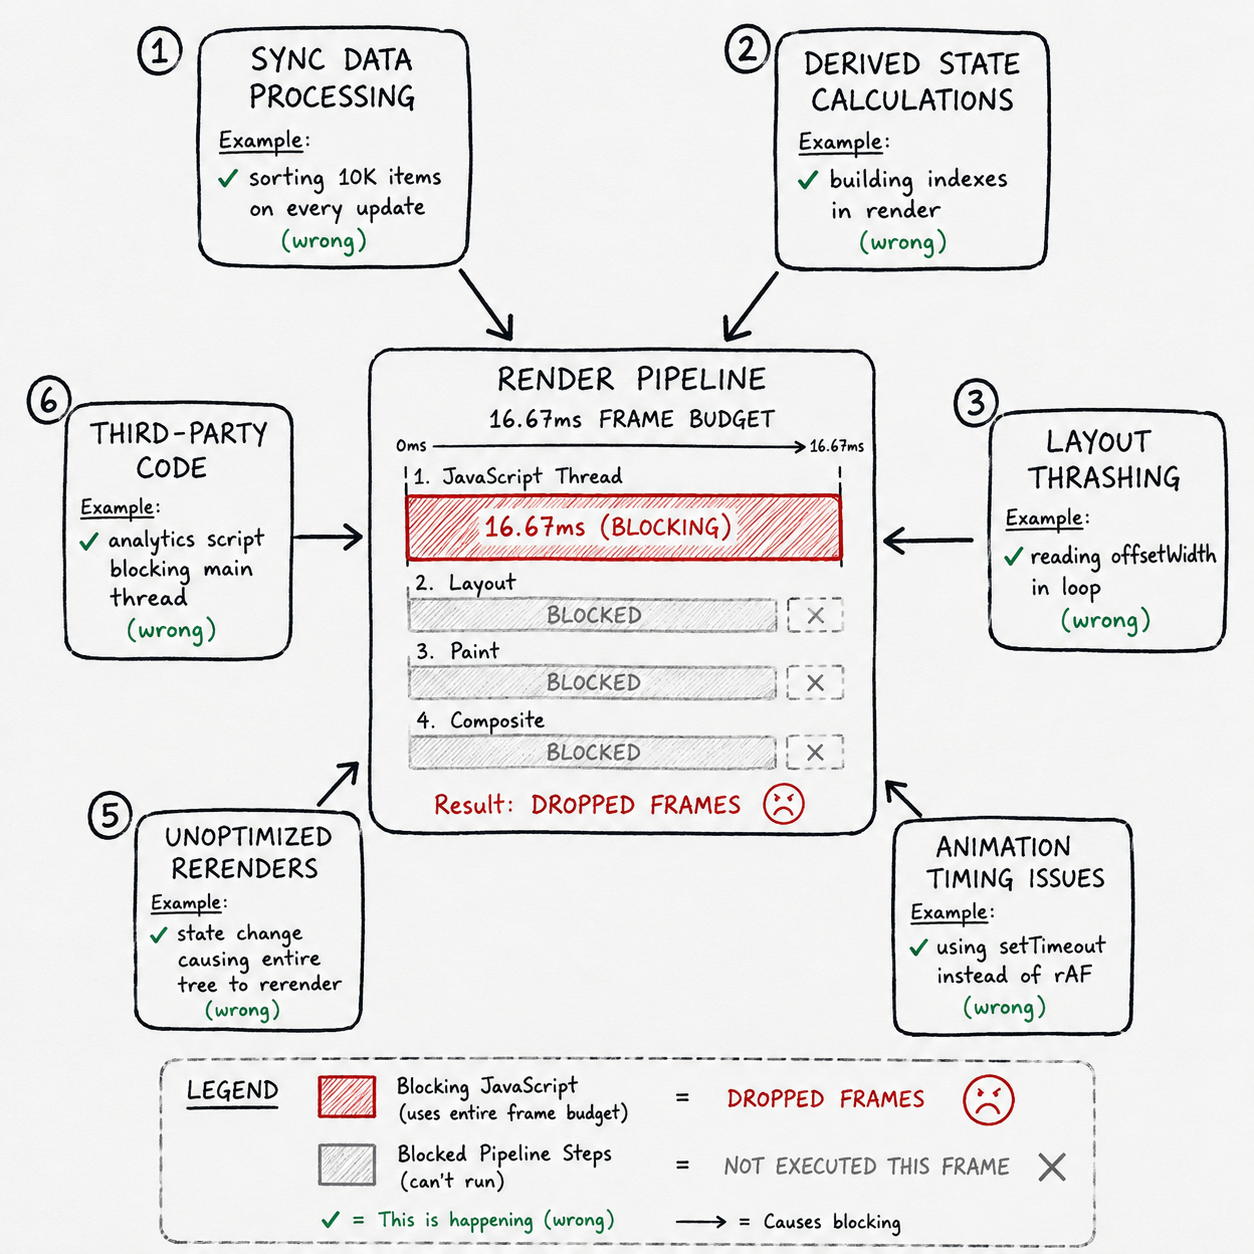
Synchronous data processing in render:
Sorting large datasets. Filtering. Mapping and transforming. Parsing JSON. These operations are fine with small data. They are blocking and expensive with large data.
Derived state calculations:
Computing statistics. Building indexes. Grouping data. All in the render method because it is convenient. Works with 100 items. Jank with 10,000.
Layout thrashing:
Reading DOM properties (offsetWidth, scrollHeight, etc.) inside a render method. Or inside a loop. The browser has to synchronously calculate layout, stop, return the value, then calculate layout again. Each read/write cycle is expensive. One read per item on 1000 items is a disaster.
Animation timings:
Triggering CSS transitions or animations inside render without understanding that render is not synchronized with animation frames. Your animation is supposed to run at 60fps but the render pipeline is blocking it.
Unoptimized re-renders:
A component re-renders when it does not need to. Or a parent re-renders and forces children to re-render. Each re-render runs the expensive work again. The framework does not know that this work is expensive. It just rerenders because the state changed.
Synchronous third-party code:
A library you import does expensive work when you call it. You call it inside render because it seems convenient. You have no idea it is a multi-millisecond operation. The library worked fine in isolation, but now your entire component pipeline is blocked.
Each of these works on your machine. Each of these breaks in production. And the framework does not warn you because the framework does not know about timing.
A hand-drawn flowchart showing six different timing bug patterns. Each as a box: "Sync Data Processing", "Derived State Calcs", "Layout Thrashing", "Animation Issues", "Unoptimized Rerenders", "Third-party Code". Arrows pointing right to a "Render Pipeline" box that shows all the patterns converging into a blocked JavaScript thread, represented by a thick red bar taking up the entire 16.67ms frame budget. Small stick figure at bottom looking confused with a question mark.
The Framework Does Not Care About Timing
This is important to understand. React, Angular, Vue — they do not have a concept of timing. They do not know about frame budgets. They do not know about the main thread.
They know about:
State management
Component lifecycle
Props and data flow
Rendering accuracy
They do not know about:
How long operations take
Whether operations are blocking
What the JavaScript thread is doing
Whether the browser can paint
This is by design. The framework is not responsible for timing. It is responsible for correctness. The contract is: "given this state, render this output." The contract is not: "render this output in time for the next frame."
This means you can write code that is correct according to the framework and temporally impossible according to the browser.
Your component says: sort this list and render it. The framework does this. The list is sorted. The component is rendered. Correct.
But the sort took 300 milliseconds. For 300 milliseconds the browser could not paint anything. The last 8 frames were dropped. Users saw nothing for almost a quarter of a second.
The framework does not care. It was asked to sort and render. It did. Mission accomplished.
Why This Only Shows Up in Production
Local development is incapable of revealing timing bugs because local development removes all the conditions that create them.
Data scale: You have 100 test records. Sorting takes 2ms. In production, you have 100,000 records. Sorting takes 600ms. The code is identical. The data is different.
CPU contention: Your machine is running only your app. Production is running your app plus analytics plus error tracking plus feature flags plus monitoring plus user behavior tracking plus service workers plus browser extensions plus competing sites in other tabs.
Network latency: localhost is 1ms. Production is 50-200ms. This changes the timing of when state arrives, which changes when renders happen, which changes load on the pipeline.
Real user behavior: You click items in a predictable order. Users click randomly. They scroll while things are loading. They interact while renders are happening. Concurrency of operations reveals timing bugs that sequential operations hide.
Dataset variance: Your test data is uniform. User data is chaotic. Some users have 100 items. Some have 100,000. Your code works for 100 and breaks for 100,000.
Local development is a best-case scenario. Production is an average case with worst-case spikes. You tested only the best case.
What Actually Prevents This
The developers who never hit this problem are the ones who think about timing even when the framework hides it.
Profile in production. Use browser devtools. Record a real user session. Look at the flame graph. How much time is JavaScript taking per frame? If it is more than 14 milliseconds, you are dropping frames.
Understand your data scale. If your component works fine with 100 items but jank with 10,000, you have a scaling problem. Test with production data volume in development. Restore a snapshot. Run it locally. Watch the performance.
Move work off the render path. Sorting, filtering, transforming — do this outside the render method. Use useMemo, useCallback, computed properties. Make expensive calculations explicit and memoized.
Know what operations cost. Sorting is O(n log n). Parsing JSON is O(n). Cloning objects is O(n). These are not free. If you are doing them for every item in a large list, that is a choice. Make it intentionally.
Test with realistic data. Not 50 test records. Not 100. Take your worst case users and load their data into development. Watch how it performs.
Monitor frame rate continuously. Measure FPS during interactions. If it ever drops below 50, you have a problem. Your users definitely noticed.
Use profiling tools that understand rendering. React Profiler, Vue Devtools, Angular's performance profiling. These show you how long renders take. Use them.
Think about concurrency. Multiple renders happening. User scrolling. Animations. Multiple API calls completing. Your code has to handle these things happening simultaneously, not sequentially.
The Deeper Problem
The issue is not React or Angular or Vue. These are good frameworks. The issue is that abstraction lets you write incorrect code that the abstraction considers correct.
The abstraction says: here is a simple model. Pass in data, get out UI. You do not have to think about rendering pipelines or frame budgets or timing.
This is beautiful. It lets junior developers build applications without understanding the browser's rendering model.
But it also lets them build applications that are broken in ways they cannot see.
A developer who understands that every 16.67ms the browser needs to complete JavaScript execution and painting will write different code than a developer who just knows "put code in render and React figures it out."
The first developer will ask: how long is this operation? Is it under 14 milliseconds? Can I move it off the main thread? Can I split it into smaller chunks?
The second developer will ask: does this work? If yes, ship it.
The framework makes it easy to be the second developer. It makes it hard to be the first developer because the abstraction hides the context where timing questions even make sense.
What You Need to Believe
Your framework is not managing your timing. Your framework is managing your state and UI. Timing is your responsibility.
When you write code, you need to think: where does this code run? In the render pipeline? In an effect? In a callback? How long does it take? Is that acceptable?
Your component does not feel slow locally because your data is small and your CPU is idle. It will feel slow in production with real data and real contention.
The gap between local and production is filled with timing bugs that the framework actively hides from you.
The developers who understand this write code that is both logically correct and temporally possible. Code that works when you have 100 items and when you have 100,000. Code that maintains frame rate under load.
The developers who do not understand this write code that works in development and breaks in production. And they spend three days debugging something that is invisible because the framework was too good at hiding how the code actually executes.
Your framework is not broken. Your code is just running on a machine you cannot see. And the machine has timing constraints that the framework does not tell you about.